
Use case
Smart date use in crop growth and yield modelling
Farmers need accurate and timely data on crop growth and expected yields in order to improve their crop management and their overall sustainability. This data is also used by agrifood partners to improve the supply, sourcing and processing of crops; by governments to ensure food safety; and security and by scientists to conduct scenario studies.
Accurate and timely data
Growth and yield predictions call for specific models and/or advanced statistics. Various models and tools have been developed for various objectives over the past three decades. But in order to predict crop growth and crop yields at the individual field level, more accurate tools must be developed that meet the criteria of current agrifood chains. To do so, existing sensor systems used to monitor soil, crops and climate should be combined with new data platforms, analytics and connectivity solutions.
Our approach: using sensor data to estimate model parameters and increase accuracy
WUR is a leader in crop growth modelling, having developed several process-based models to estimate potential production, water-limited production and/or water-limited and nitrogen-limited crop production for key agricultural crops. The new approach aims to use newly available sensor data from soil, crop and climate monitoring systems to estimate model parameters and to increase accuracy. This also calls for access to crop management data and for the accurate processing of sensor data. This approach is currently being tested for potatoes and will be validated by comparing predictions to actual yields obtained.
(Expected) impact
This study involves a new scientific approach to crop yield studies at the farm level. It is expected to improve the accuracy of yield predictions with a potato crop growth model. Accuracy should be within 10% in the weeks leading up to the harvest. This is far more accurate than conventional models at the regional level. These more accurate prediction models are expected to increase the efficiency of farm management by 10%. This approach can be used as a new source of information for smart farming applications, such as apps on Akkerweb.
Next steps
This approach will be further developed and refined for other crops in the future.
Facts & Figures
We present a showcase with storyline in four figures.
A. High resolution yield data from harvester

Storyline
This showcase presents an illustration for a single plot of how different data sources can be integrated to provide accurate and timely data on crop growth and expected yields. This is our story:
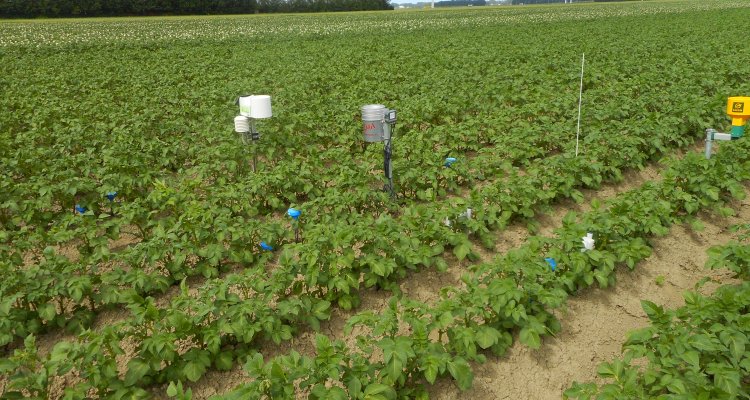
- A soil scan before planting delivered high-resolution soil data (Figure B, sensor see figure below Figure B);
- During the season, biomass was monitored using satellite imagery (Figure C, black squares);
- However, satellites can only see aboveground biomass. A crop growth model was used to additionally simulate potato tuber yield (Figure C, red lines);
- The farmer made in-season measurements of leaves, stem and tuber growth, which provides an independent check (Figure C, red and green dots);
- At harvest, yield differences within the plot were measured during the harvest (Figure A, backside plus harvester). Note the large spatial variability in yields;
- Higher yields were recorded in the high EC zone (Figure B versus A);
- The crop growth model could reproduce this yield variation (Figure C).
B. High resolution soil data from soil scan

The figure shows a map of soil electric conductivity (EC, mS/m). EC is related to various physical parameters including soil moisture content.
C. Integration of crop growth models & satellite-based crop growth monitoring

Tools used
- Several layers of geo-referenced data (soil sensors, yield map, time series of satellite data)
- National soil map
- National weather data services
- Crop growth model (Wofost)
- Non-linear optimization routines from the R statistical package
- Relational database (Postgresql/PostGIS)
- Farm management data (from DACOM, Crop-R)
- Field-level measurements of soil water content, crop biomass, LAI, number and weight of tubers
Cooperation with partners
- WUR - Plant Sciences Group
- WUR - Environmental Sciences Group
- PPS PL2.0
- IoF2020