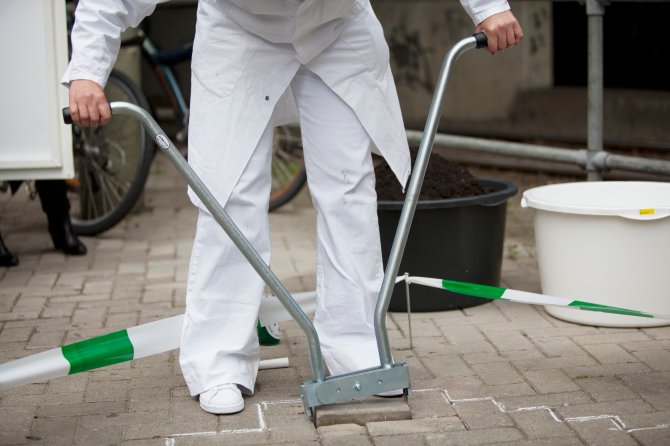
DEPAVE! Turfmarkt, The Hague
According to a recent study, The Hague has the warmest city centre of the Netherlands. The effects of this ‘urban heat island’ can easily be mitigated by removing pavement and covering more city surfaces with vegetation. An example of this approach is the ‘DEPAVE!’ project, located next to the City Hall of The Hague. LfM’s film DEPAVE! focuses on sharing innovative best practices and knowledge amassed in water projects in The Hague and Portland, Oregon.
Measurements with a tricycle
In the project "Summer in the City' meteorologists of Wageningen UR work together with the Netherlands eScience center on computer models that predict the weather at street level in more detail. Measurements are done with a specially equipped tricycle by cycling through the city to identify temperature differences between the districts. In new housing estates and industrial areas, large heat islands occur because those places are heavily paved.
Measuring urban temperatures with a smartphone
For research on heat and health, it is of great importance to identify as much detail as possible of the temperature distribution in urban areas. Researchers from the KNMI and Wageningen UR have developed a method in which the batteries of smartphones deliver the temperature data.

Heat stress maps in street level
On hot days it can be uncomfortably warm in the city. But the temperature can differ per street. Meteorologists of Wageningen UR together with the Netherlands eScience center measure the impact of buildings, vegetation, water, wind and shadow on the local temperature. With that knowledge they can create a weather forecast for every street in the Netherlands. In that way, we help people find refreshment in the city, sometimes only a few hundred meters away. These data can also help with urban planning.
Summer in Amsterdam analysed
For the project ‘Summer in the City' Wageningen UR has placed 30 small weather stations in Amsterdam. With these measurement setups we map the spatial variability of the microclimate in the city. This is not only relevant for governments and health services to prevent or reduce the effects of heat stress for humans, but also for urban designers to take into account the quality of life during hot summers when (re)designing cities.
App ‘Weerbeleving’
How do you experience the extreme temperatures in a heat wave? When does the heat become unbearable? What can you do to reduce the heat stress? The new app "Weerbeleving" indicates a weather experience expectation by location in the Netherlands and up to 33 hours ahead. The android app displays with colors and symbols how hot people experience the weather and expresses that in degree of "thermal stress". The app was developed by a Wageningen University student in cooperation with meteorologists at Wageningen UR.
A weather archive for the city
How has the weather in the city developed over the years? Has it become warmer? Has summer rain become more intense? In the project ERA-urban Wageningen meteorologists are developing, together with the Netherlands eScience center, a 15 years long record of urban weather at a spatial fine Stakeholders in the water, energy and health sectors can use it for planning their activities.