Showcase
Waste water connectors in the Netherlands
Can residual water from a food processing factory become irrigation water for the crops on a field nearby? And what about valuable dissolved substances? Can we get them out of the waste stream, back into the food system? Food processing industries in the Netherlands are exploring how water can be reused. One way to increase the recycling efficiency is to combine nature-based solutions with technology. We developed a toolkit for NBS technologies and identified suitable areas in the Netherlands for future climate resilient applications. You are invited to contact us if you would like to make use of knowledge and tools.
Climate resilient water supply
Under average climatic conditions, freshwater supply for Dutch agriculture is excellent. However, in situations with a low river discharge and a high precipitation deficit, the freshwater supply cannot meet agricultural freshwater demand during the growing season, as we experienced in 2018 and 2019. This is particularly true for the rainfed agricultural areas in the southwestern part of the Netherlands that have no access to river water. Natural processes can be explored to solve this, such as the use of constructed wetlands to realize additional water for food production or drinking water production by purifying used water. However, competing land claims in the Netherlands are a barrier to realize these type of landscapes. That is why we explored combinations of nature-based solutions with waste water treatment technology. In this way spatial claims become smaller and food processing industries become less dependent on conventional water resources that are under stress due to climate change. When purification of used water builds entirely on natural processes, the water quality will fluctuate with the dynamics of the landscape and climate. With the help of technology, these fluctuations can be reduced in the case a constant water quality is a prerequisite for food production.
Exploring and mapping feasible areas for water reuse
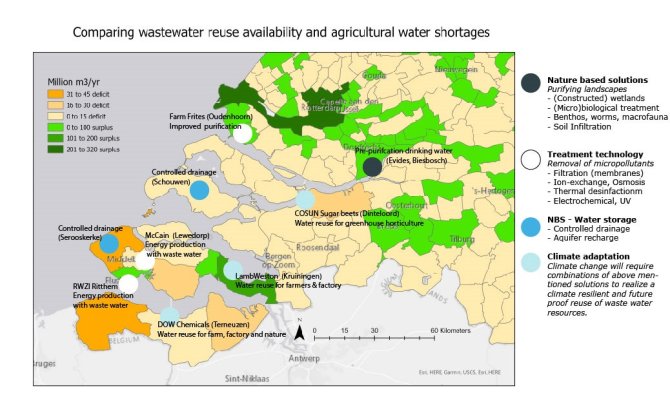
The map below (Figure 1) combines spatial information of the Land Use Database of the Netherlands (LGN7) with spatial data from the European Pollutant Release & Transfer Register (E-PRTR), developed by the European Environmental Agency. The map is a section of the Southwestern part of the Netherlands.
The agricultural water demand is based on the potential transpiration, actual transpiration and irrigation based on the current climate for the period 2009-2018 with outcomes for 10 day periods for 250x250 meter grids with support of the Netherlands Hydrological Instrument (NHI).
Based on the E-PRTR data, an estimate has been made of the yearly potential supply of process water (in M3) from industry and sewage treatment, using the reported phosporus load as a proxy.


What is on the map?
The green areas on the map are municipalities where this potential water supply exceeds the water demand from agriculture. In these areas it is interesting to explore whether this unused water resource can be an addition to the current available water resources (surface water, precipitation, groundwater). This new water resource can fulfill this role for agriculture or food production within, but also outside the municipality in question. Subsequently, it was examined which combinations of Nature Based Solutions and water technologies could be used in the future to use this potential water source as climate adaptation in this part of the Netherlands.
Validation (2022) - To get a first impression of the climate sensitivity of this water resource we will explore in which areas the potential new water resource remains greater than the future water demand from agriculture, under the following assumptions: no land use change (same crops are cultivated), similar irrigation schemes but with increasing evaporation and changed precipitation patterns as projected by the KNMI-2013 scenarios. This provides a first picture in which municipalities the potential additional water supply appears to be sensitive or remains robust under climate change. In the future, the crop choice, land use and farm management will also change and there will also be adjustments in the irrigation methods. This wll be also subject of research in 2022.
Additional online map
Online, a background map (made in 2020) is provided: a prototype map which combines information on potential resources with agricultural water demand has been published online (see: Wastewater Connectors, arcgis.com). The blue dots are sources of waste water originating from, amongst others, food & Beverage and municipal waste water treatment (derived from E-PTR data from 2019). The size of the dots gives an idea of the magnitude (in m3/year) of the potential water source. The blue boundaries around the resources of waste water indicate the acceptable transport costs, which is measured as a function of distance, land cover and topography. The maps on the internet are made for the whole of the Netherlands. Disclaimer: Only Southwest Netherlands has been validated in expert sessions.
Technology portfolio
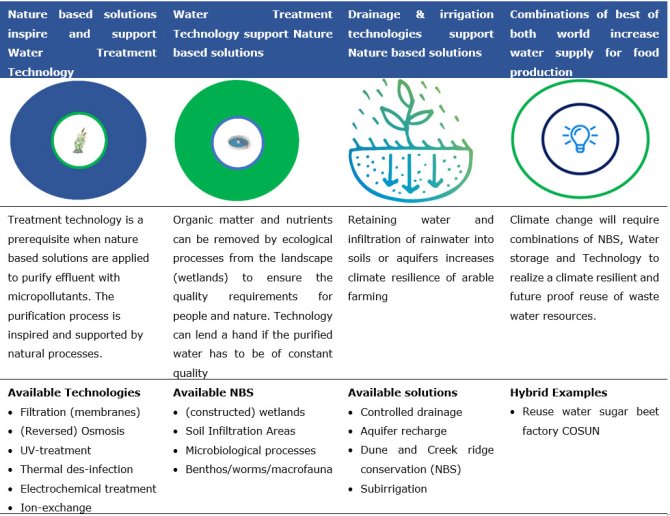
Technology can be supported by Nature or Nature can be supported by Technology. Water Treatment processes, based on natural processes, could very well be an effective measure to re-use water and nutrients. To reduce the emissions of micro-pollutants such as crop protecting agents (CPAs), PFAS and also pharmaceuticals and medicine residues current NBS are not suited. The disadvantage of so-called polishing technologies based on oxidation like ozonisation and other advanced oxidation processes is that they are not selective and also interact with the natural occurring organic material (NOMs) in the effluent. By establishing hybrid solutions consisting of both NBS and technology best of both worlds is reached and quality and quantity can be guaranteed (see table 1).
Stakeholder engagement
The background map and Technology Portfolio were discussed with stakeholders (April 2021) in a workshop to validate the used assumptions for one specific region: Southwest Netherlands. The results were also used to identify knowledge needs with representatives from the food processing industry in two meetings (May and June 2021) and drinking water industry (December 2021). Important lessons from the stakeholder engagement were:
• Not only water is a recyclable resource from waste water, also the dissolved substances. The consulted private entrepreneurs had, in particular, need for solutions to valorise the latter, while the consulted policy makers are looking for solutions to optimize water supply and de-mand for agriculture in this region.
• Security of supply is more important to private parties than the underlying principle (nature based, technical, etc.), while the consulted policy makers consider a nature based solution as an important added value.
• In regions with creek ridges the agricultural water demand (irrigation) is overestimated in this map, in reality the climate resilience of agricultural water demand is higher than modelled, explained by the natural phenomenon of rainwater lenses (also a NBS). This can be solved by placing these areas in a separate category.
• The geographical chosen borders to compare water supply and demand on the basis of maximum acceptable transport costs of water (pipes) is difficult to grasp for stakeholders. To make it recognizable, we have scaled up these units to the areas of the municipalities.
Cited literature
Appelman W.A.J., Creusen, R.J.M., Steemers-Rijkse I., Veraart, J.A., Voskamp,
I.M., Wetser, K., Duku, C., Nuesink, J.G., Weide, R.Y. van der, Elissen, H.J.H.
2021. Wastewater connectors: A Nature Based Solutions (NBS) Toolkit.
Stowa (2020), Deltafact: Hergebruik van afvalwater. Retrieved from: stowa.nl
Zuurbier KG, Kooiman J, Groen M, Maas B, Stuyfzand PJ (2014). Enabling
Successful Aquifer Storage and Re-covery of Freshwater Using Horizontal
Directional Drilled Wells in Coastal Aquifers. Journal of Hydrological Engineering.