News
Grasslands up to 37% less green than normal
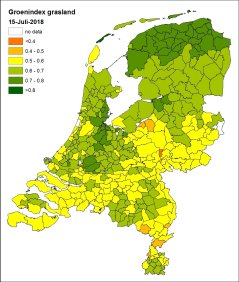
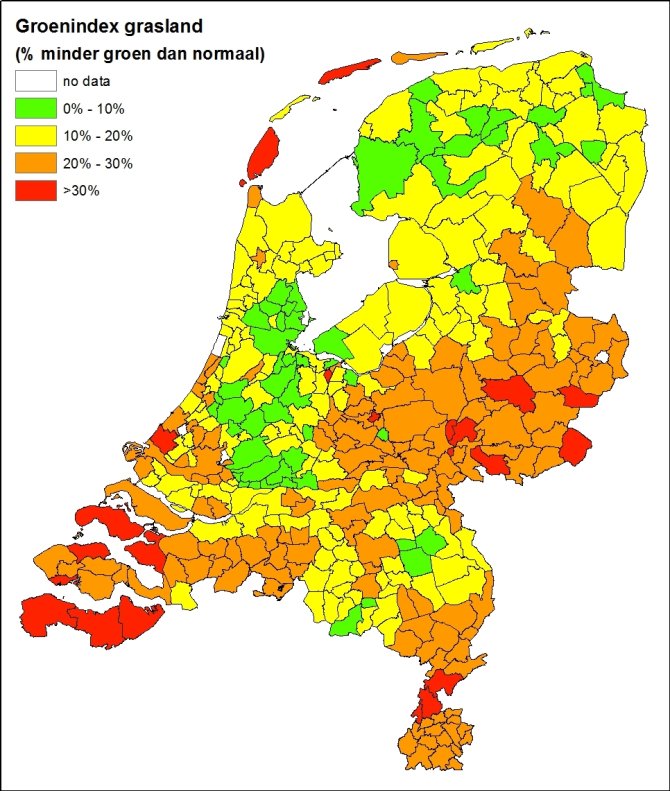
We all know it is dry in the Netherlands now. And that because of this, also plants are having a hard time. Groenmonitor.nl from Wageningen Environmental Research has recently achieved to indicate to which extent and where exactly in the Netherlands this occurs. On the basis of satellite images at hand it is shown, that grasslands in the Netherlands are at the moment 17% less green than normal. Regional figures however differ widely. All is fairly well in Groningen, Friesland and the Green Heart. But the intense summer of 2018 has left a significant mark already in Twente, Gelderland, Zeeland, parts of Brabant and Limburg and in the coastal areas. In these regions, the grass is down to 37% less green.
It has not been raining much in the Netherlands ever since the beginning of June. We can see day by day what this does to the grass on our lawn and on the meadows, that are slowly changing into brown-yellowish prairie landscapes. Whether this is happening all over the Netherlands, is not that clearly visible however.
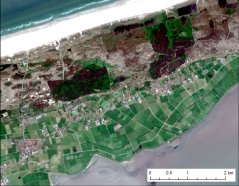
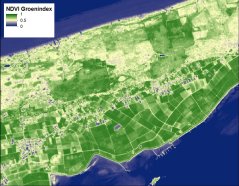
For this, it is needed to be able to determine the greenness of the grass. This is possible nowadays with satellite images. These can be ‘translated’ into a green vegetation index, that quantifies the total volume of green biomass. These green vegetation index maps are publicly accessible via de Groenmonitor. The greenness index can be determined down to plot-level and the withering away of grass can be mapped out, as is shown by the satellite pictures of Terschelling.
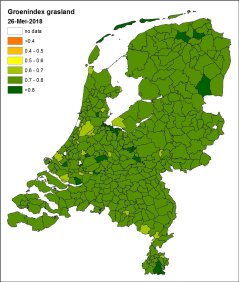
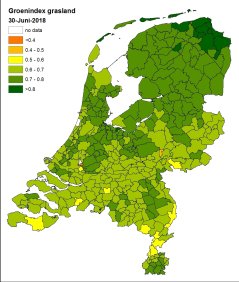
The regional differences that the drought has on grasslands can be mapped out on the basis of the green-index images. We used satellite images taken at four different moments during the growing season and calculated the average green index for grassland per municipality. There were no signs of drought yet at the beginning of the growing season on 26 May and the grass laid green all over the place.
On 30 June, after around four weeks of drought, one may see the first differences appearing. In the northern part of the Netherlands, the drought hardly had any impact on the grasslands yet, the greenness index values remain the same. But in the southern half the green vegetation index drops with around 10%. These differences increase in July, while also the North becomes more troubled by drought.
Clearly, the sandy soil areas in the Netherlands (Eastern-Overijssel, Gelderland, parts of Brabant and Limburg and the coastal areas) are more deprived than the other areas. Grasslands in Zeeland also show great problems caused by the drought, even on the clay soil there, that has a higher capacity for water retention. This is the province even, that includes the municipality with the least green grass: Flushing, with 37% less green grass than normal.
In the Green Heart the grass is, on the contrary, still green because of the high water level in the ditches. However, this doesn't imply grass properly growing: for the growth has all but halted. The grass manages to survive just, where it is really withering and browning, in the sandy soil areas.
On the border of Brabant and Limburg the grass seems to be growing a little bit. In a number of municipalities there, the grass became a bit greener between 15 and 26 July, possibly because of the frequent watering of grasslands.
For the time being, there is no end in sight of the intense summer of 2018. It is expected that the condition of grass will deteriorate further. Arable farming will also be facing trouble because of the drought. The Groenmonitor.nl will closely follow this situation and will be mapping it out for you.
Groenindex
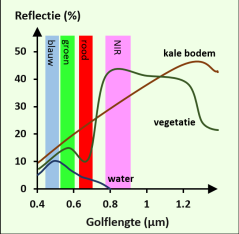
Plants, or rather green biomass, strongly absorb red sunlight for use in photosynthesis and reflect most of the near-infrared (NIR) light. With bare soil (rocks, sand, ploughed-over land), the difference between absorption and reflection is far less. This principle is being used to measure the green vegetation index.
The best known is the Normalised Difference Vegetation Index (NDVI). The NDVI vegetation index is the ratio between the reflections of the red and the NIR light that can have a value between 0 and 1: NDVI=(NIR-Red)/(NIR+Red). Whereby open water has a NDVI green index of zero and bare soils a value of around 0.1. The first vegetation (for example small blades of grass appearing) renders a value of 0.3. At 0.5 the crop is almost closing in and a crop with several layers of vegetation may render values of near to 1.
