
Impact of silt on bedforms and sediment transport
A flume model to test the influence had by silt concentration in sand-silt mixtures upon channel bedform geometry and sediment transport rates.
Sjoukje de Lange
Iris Niesten
Sanne van de Veen
David Boelee
Kryss Waldschläger
Ton Hoitink
Subaqueous geometric bedform properties such as height, length and leeside angle are crucial in determining hydraulic form roughness and interpreting sedimentary records. Traditionally, bedform existence and geometry are predicted with phase diagrams and empirical equations, which are mostly based on uniform, cohesionless sediments. However, mixtures of sand, silt and clay are common in deltas, estuaries, and lowland rivers where bedforms are ubiquitous. Bedform dimensions may decrease when clay (<4μm) is present and when high suspended sediment concentrations (SSCs) suppress bedform growth. Non-cohesive silt (~30 - 63μm) is mainly transported in suspension and is therefore expected to limit bedform height and length. Weakly-cohesive silt (4-~30μm) is expected to limit bedform development similar to clay. Evidently, it is unknown what the exact influence is of silt on bedform dimensions.
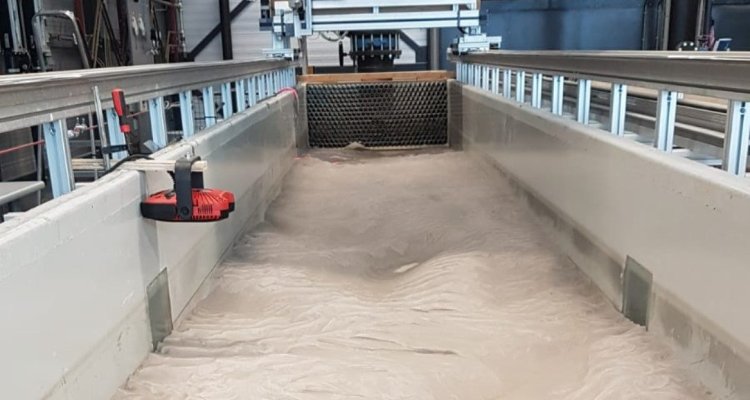
In this flume model we tested the influence of silt in sand-silt mixtures on bedform geometry and sediment transport characteristics. The 15m tilting, recirculating flume in the Kraijenhoff van de Leur Laboratory was used for this analysis. Sand and silt content were systematically varied for various discharges and the resulting dynamic near-equilibrium bed geometry was measured with a line laser scanner (see Figure 1).

Water levels, 3D velocity profiles, suspended sediment concentration (SSC) and grainsize distributions were also recorded. The data collected will be used to seek relationships between bedform geometry and silt content in the riverbed, bed shear stress and SSC. It is hypothesised that with increasing silt concentration, SSC increases and the hydraulic roughness decreases, resulting in a decrease in bedform height and length. Figure 2 shows an example of the dune beforms generated during the experimental runs, prior to laser scanning.
